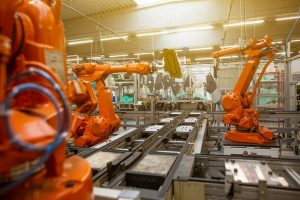
In the high-stakes world of industrial automation, speed dominates the conversation. When manufacturers evaluate robotic systems, one metric screams loudest: cycle time. Can this robot load parts faster than our operator? Can it beat our current benchmark? At Uchimura Robotics, we’ve witnessed how this laser focus on raw speed leads companies down a path of unnecessary complexity, inflated costs, and premature system failures. The truth? Optimizing solely for cycle time is like tuning a race car for a single lap while ignoring the engine’s survival in a 24-hour endurance race. It’s time to shift gears and embrace a smarter approach to automation—one prioritizing sustainable throughput, reliability, and total cost of ownership.
The Seductive Trap of Cycle Time
Cycle time—the total time to complete one full operation sequence—has long been manufacturing’s golden metric. It’s tangible, easy to measure, and seemingly straightforward. The request we hear daily is: “Our operator does this in 27 seconds. Can your robot match that?”
This question reveals a fundamental misunderstanding. That 27-second manual cycle represents a peak performance—achieved under ideal conditions for short bursts. It ignores the human realities of production floors: operators take breaks, experience fatigue-induced slowdowns, handle material inconsistencies, or wait for upstream processes. What appears as a 27-second cycle often translates to significantly lower shift-long productivity.
Robots, however, operate in a different paradigm. They don’t need coffee breaks, don’t slow down after hour six, and aren’t distracted by conversations. This is where manufacturers fall into the Cycle Time Trap: demanding robots replicate human peak speeds instead of leveraging robotic endurance advantages.
The Endurance Edge: Why Consistency Trumps Speed Bursts
Imagine two marathon runners:
- Runner A sprints at world-record pace… but stops every 30 minutes.
- Runner B maintains a steady, slightly slower pace… for 8 hours straight.
Who finishes with more miles? Runner B wins decisively. This is the robot’s superpower.
Real-World Math That Matters:
Operator Scenario: 27-second peak cycle time. But with breaks, fatigue, and delays, actual productive time is 6 hours per 8-hour shift.
Output = (6 hrs * 3600 sec/hr) / 27 sec/cycle = 800 parts/shift
Robot Scenario: 35-second cycle time. Runs uninterrupted for 7.5 hours (allowing for minor pauses).
Output = (7.5 hrs * 3600 sec/hr) / 35 sec/cycle = 771 parts/shift
The Revelation: A robot 30% “slower” per cycle nearly matches human shift output. Add a second shift? The robot produces 1,542 parts with zero overtime pay. This exposes the flawed logic of fixating on cycle time alone. At Uchimura Robotics, we design cells for shift throughput targets, not arbitrary speed benchmarks. Discover how we calculate true ROI beyond cycle time.
Mechanical Stress: The Hidden Cost of Redlining Your Robot
Speed isn’t free—it’s paid for in component wear. Think of your robot like a car transmission:
- Smooth Driver: Gradual acceleration → transmission lasts 200,000 miles.
- Aggressive Driver: Constant hard acceleration/braking → transmission fails at 80,000 miles.
Robots suffer identical physics. High-speed cycles demand extreme joint accelerations, causing:
- 2-3X faster wear on gearboxes and bearings
- Premature failure of grippers or tooling
- Vibration-induced misalignment in precision tasks
A study by the Association for Advanced Automation found that cells running at 90% max speed showed 40% longer mean time between failures (MTBF) than those at 100%. That 10% speed gain cost 2X more in maintenance and downtime.
The Uchimura Approach: We tune motion profiles to be “just fast enough,” optimizing for longevity over bragging rights. See our motion smoothing techniques in action.
The Triple Trade-Off: Speed vs. Reliability vs. Cost
Pushing cycle times lower triggers a domino effect of escalating costs and complexity:
| Speed Increase | Required Upgrades | Cost Impact | Reliability Risk |
|---|---|---|---|
| 10% Faster Cycles | Precision grippers, reinforced tooling | +$8,000-$15,000 | Moderate vibration issues |
| 20% Faster Cycles | High-end vision guidance, servo-driven fixturing | +$20,000-$35,000 | Increased calibration needs |
| 30%+ Faster Cycles | Safety laser scanners, premium robot model, vibration damping | +$40,000-$75,000 | High maintenance frequency |
Real Consequence: Spending $25,000 to shave 2 seconds/cycle seems logical—until you realize:
- Your downstream press still takes 40 seconds
- Maintenance costs rise 18% annually
- ROI stretches from 18 months to 3+ years
We help clients avoid this trap through Balanced Cell Design™, where speed harmonizes with reliability and budget. Explore our cost-optimized solutions.
Bottlenecks Exposed: Why Your Robot Isn’t the Problem
In 70% of automation cells we audit, the robot isn’t the bottleneck. Common constraints include:
- Human-Dependent Tasks: Loading/unloading times (avg. 8-15 sec)
- Machine Processes: Welding/curing cycles (fixed 30-60 sec durations)
- Inspection/QC: Vision system processing (5-10 sec/part)
- Material Flow: Conveyor synchronization delays
Case Study: A client insisted on a 20-sec robot cycle for press loading. Their press took 45 sec/cycle. Result? The $40,000 “speed-optimized” robot sat idle 55% of the time. Our redesign:
- Matched robot cycle to press (45 sec)
- Added upstream kitting station (handled by operator)
- Implemented predictive maintenance sensors
Outcome: Throughput increased 22% with $15,000 lower investment.
The lesson? Sync to your slowest constraint. Learn our bottleneck analysis methodology.
Shift Throughput: The Metric That Actually Drives ROI
Replace cycle time with these KPIs that impact your bottom line:
- Parts Per Shift (PPS): The ultimate measure of value delivered
- Operational Uptime (%): Ratio of productive time to total available time
- Mean Time Between Failures (MTBF): Hardware reliability under real conditions
- Cost Per Part (CPP): Includes depreciation, maintenance, energy
Why This Works: A cell running at 35 sec/cycle with 95% uptime produces more than a 25 sec/cycle cell at 70% uptime. At Uchimura, we embed IoT sensors in every deployment to track these metrics live. View our real-time monitoring dashboard.
Designing for Sustainable Automation: 7 Uchimura Principles
- Benchmark Real Output, Not Theoretical Peaks: Track actual shift output of manual processes for 1 week.
- Target 85-90% of Max Robot Speed: Extends component life while hitting throughput goals.
- Implement Predictive Maintenance: Vibration sensors and thermal imaging catch wear before failure.
- Right-Size Components: Avoid over-engineered vision/grippers where simpler solutions suffice.
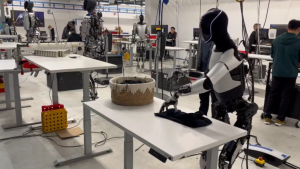
- Design for Human-Robot Collaboration: Optimize handoff points to eliminate waiting.
- Include Buffer Zones: Allow 5-7% time for minor variations without faulting.
- Plan for Upgrades: Modular designs let you increase speed later if bottlenecks shift.
The Future-Proof Automation Mindset
The industry’s cycle time obsession reflects a deeper issue: viewing automation as merely replacing human labor. Truly transformative automation redesigns processes holistically.
What This Enables:
- Predictable Production: Cells output 1,000 parts/shift—every shift
- Lower TCO: 20-30% reduced maintenance vs. speed-optimized cells
- Easier Scalability: Modular cells replicate consistently
- Faster ROI: Achieved in 12-18 months, not 3+ years
At Uchimura Robotics, we’ve helped manufacturers like you increase annual throughput by 35% while reducing cycle time emphasis. The result? Automation that works relentlessly—not just rapidly.
Ready to Optimize Beyond Cycle Time? Stop chasing seconds and start building sustainable automation. Schedule Your Free Cell Assessment with Uchimura’s engineers today. Let’s design a solution focused on what truly matters: your long-term productivity and profitability.